 |
Bonn, Germany (SPX) Aug 30, 2010 For a month now, we have been acquiring altitude models with the TanDEM-X and TerraSAR-X satellite pair. Already, over 1000 products have come out of our operational processing chain. Alongside many test images, some of the data also give an insight into how humankind has shaped the surface of the Earth - and how the highs and lows around them have determined the course of their lives. Many of the interferometric images created over the last few weeks have used test data acquired over flat areas to enable us to test the stability and precision of our imaging and processing chains with minimal altitude changes. Some of the images, on the other hand, have been of exceptionally complicated terrain, in order to test the transformation of interferograms into altitude data. The satellites are still not flying in close formation with synchronous data acquisition, so the ultimate altitude precision cannot yet been achieved. Also, the final steps for calibrating the processing chain have not yet been performed. Nevertheless, the images are already of impressive quality and are showing us details that were not previously visible from space. We in the processing team have always enjoyed activating the display software in the processor and looking not just at a dry series of numbers but also at the 3D elevation models (Digital Elevation Models; DEMs) that the software produces. There are several ways we can look at the 3D structure of the terrain. The images on this page use the radar signal (backscatter) intensity to determine the brightness of the image and the altitude of the terrain to select the colour (from blue-green to red-brown and then white). Of course, the computer can also 'look' at the DEM from an oblique angle to achieve a 3D-effect, with the heights exaggerated for clarity. The example of the 3718-metre high Mount Teide, on the island of Tenerife, shows particularly well how the two radar satellites perceive the landscape. The satellites imaged the island at an angle from the left, and the dark shadows in the valleys are areas that the radar signals could not reach, while the bright sides of the mountain were fully illuminated. Shadows and the deformations typical of radar signals make it difficult for the processor to calculate the correct altitudes; so, in later phases of the mission, other viewing angles will be used to fill the gaps. The influence of human activity can be seen here in the bright settlements and agricultural land that nestle along the coast beneath the volcano. This view is far from showing the full potential of the new generation of DEMs made possible by TanDEM-X. A smaller detail from a view of the Bavarian region around our facility at Oberpfaffenhofen and its nearby airport is shown here at only one-eighth of the full resolution of the raw data, and yet it still shows the effect of human activity in the altitude data. Farms and towns have eaten into the forests and a number of high buildings, motorways and railway lines can be recognised. No one could fail to see the effect of human activity in the opencast mining area between Cologne and Aachen. The mines and spoil heaps are several kilometres across. While human activity has formed the landscape here, in other parts of the world an altitude difference of just a few metres - or even centimetres - can be of vital importance. One of our DEMs, created on 6 August in the Khairabad region of northern Pakistan, shows how extended the low-lying areas on the banks of the River Indus can be. These potential flood zones - clearly visible in the image - are inhabited. Here too we have exaggerated the altitude scale to make the relatively small differences clear. Our processor does not just produce DEMs; even during the current commissioning phase, a number of interferometric experiments are being analysed by scientists at DLR and elsewhere. One example is the Petermann Glacier in northern Greenland, from which a gigantic iceberg has recently broken off - making The Face Of The Earths around the world. In this case, the interferometric phase shows not just the contour lines, but also signs of a small movement of the ice in the three-second period between the two satellite image acquisitions (indicated by the rapid change of colour on the smaller ice floes). Data like this enable scientists to determine the drift of ice and are important inputs to the areas of climate dynamics and the interaction between the sea and glacial ice.
Share This Article With Planet Earth
Related Links TanDEM-X Earth Observation News - Suppiliers, Technology and Application
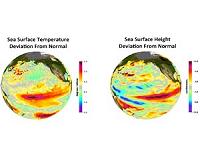 NASA/NOAA Study Finds El Ninos Are Growing Stronger
Pasadena CA (JPL) Aug 27, 2010 A relatively new type of El Nino, which has its warmest waters in the central-equatorial Pacific Ocean, rather than in the eastern-equatorial Pacific, is becoming more common and progressively stronger, according to a new study by NASA and NOAA. The research may improve our understanding of the relationship between El Ninos and climate change, and has potentially significant implications for lon ... read more |
|
| The content herein, unless otherwise known to be public domain, are Copyright 1995-2010 - SpaceDaily. AFP and UPI Wire Stories are copyright Agence France-Presse and United Press International. ESA Portal Reports are copyright European Space Agency. All NASA sourced material is public domain. Additional copyrights may apply in whole or part to other bona fide parties. Advertising does not imply endorsement,agreement or approval of any opinions, statements or information provided by SpaceDaily on any Web page published or hosted by SpaceDaily. Privacy Statement |


 del.icio.us
 Digg
Digg Reddit
 YahooMyWeb
 Google